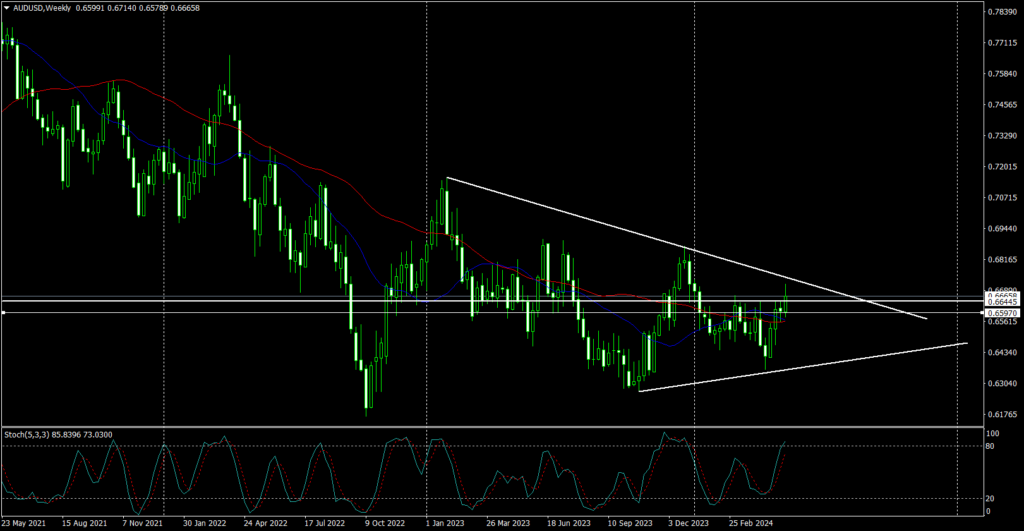
Aussy’s rally Wednesday has taken us through a resistance zone built over the course of the year. The idea seems to be that interest rate differentials between Australia and the US is set to contract soon following weak US economic data and moderate inflation. Note that this gap in interest rates following the previous aggressive tightening cycle by the Fed has been a big reason for the weakness in Aussy to current levels vis-a-vis the US Dollar for the last two years or so. See the charts at the bottom for an idea of relative historical values.
Resistance
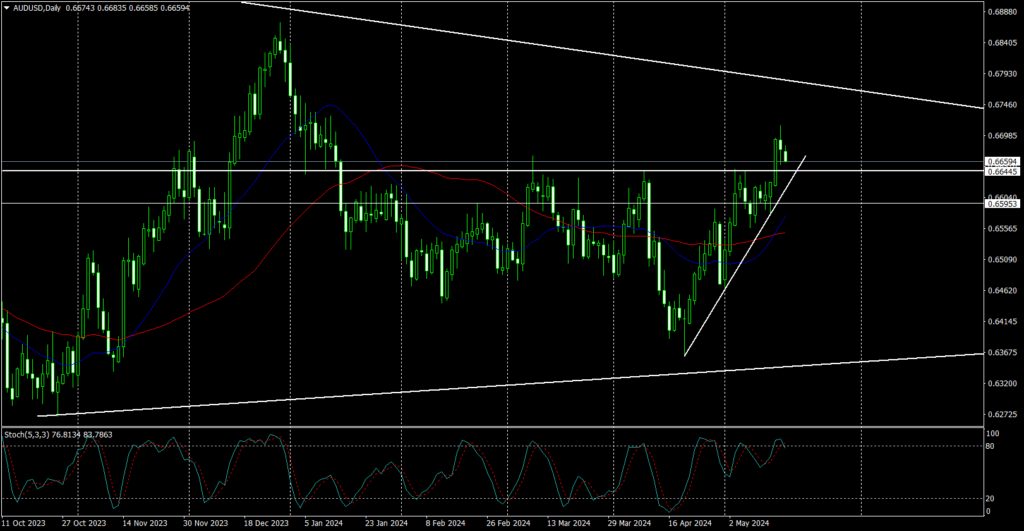
- 0.67371 – Intraday Consolidation Highs from January
- 0.67140 – Swing High
- 0.66846 – Intraday Consolidation Resistance
Support
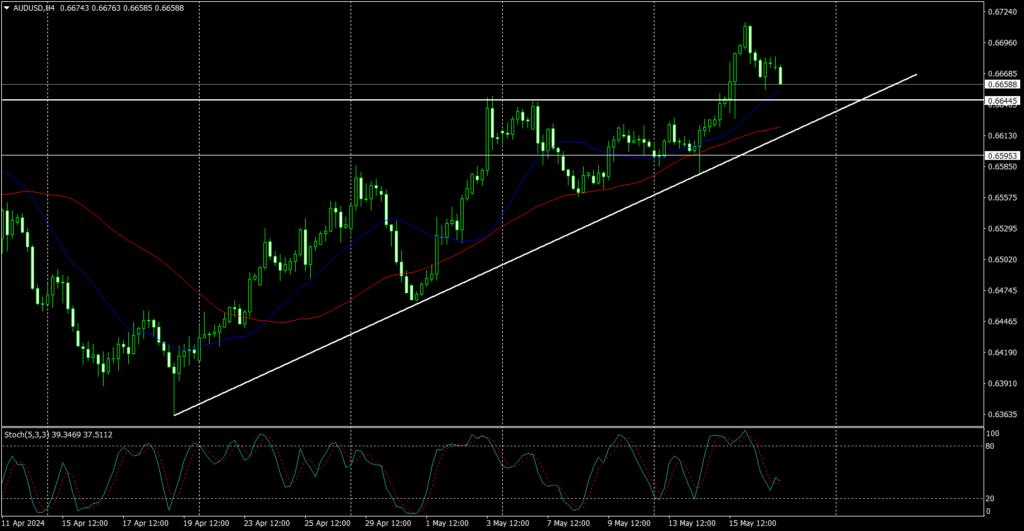
- 0.66445 – Daily Range Play Highs
- 0.65970 – Intraday Consolidation Floor
- 0.66570 – 20D Moving Average
We are already seeing a pullback in AUDUSD the question before us now is whether at the end of the day we close or hold above the 0.66445 price point. Note however our trend line in the 4H picture and the overall scenario has us focused on looking for the next up leg. Long tails in the hourly charts off 0.66445 would be an excuse for going long, or in the case of a deeper pullback a bounce off the trend line. Bears would need a close below 0.66445 in the daily scale before we would be interested in looking for a steeper drop to the daily moving averages.