

Welcome to our comprehensive guide on candlestick charting, a powerful tool used by traders and analysts to interpret market movements and predict future price actions. Candlestick charting traces its roots back to ancient Japan, where the legendary rice trader Munehisa Homma first developed the technique in the 18th century. Homma’s pioneering work in tracking the supply and demand dynamics of rice markets laid the foundation for what we now know as candlestick charting.
Munehisa Homma’s insights were revolutionary for his time, as he meticulously recorded market prices and observed recurring patterns that signaled shifts in sentiment and price direction. Through his observations, he developed a system of charting that visually represented market movements, allowing traders to make more informed decisions based on historical price data. Homma’s methods were shrouded in secrecy and passed down through generations in Japan, contributing to the mystique surrounding Japanese candlestick charting.
It wasn’t until the late 20th century that candlestick charting gained widespread recognition outside of Japan, largely due to the efforts of Steve Nison. Nison, a renowned technical analyst, introduced candlestick charting to the Western world through his seminal work, “Japanese Candlestick Charting Techniques.” By translating and interpreting Homma’s techniques for a global audience, Nison brought the power of candlestick analysis to traders and investors worldwide.
The Candlestick has three basic parts:
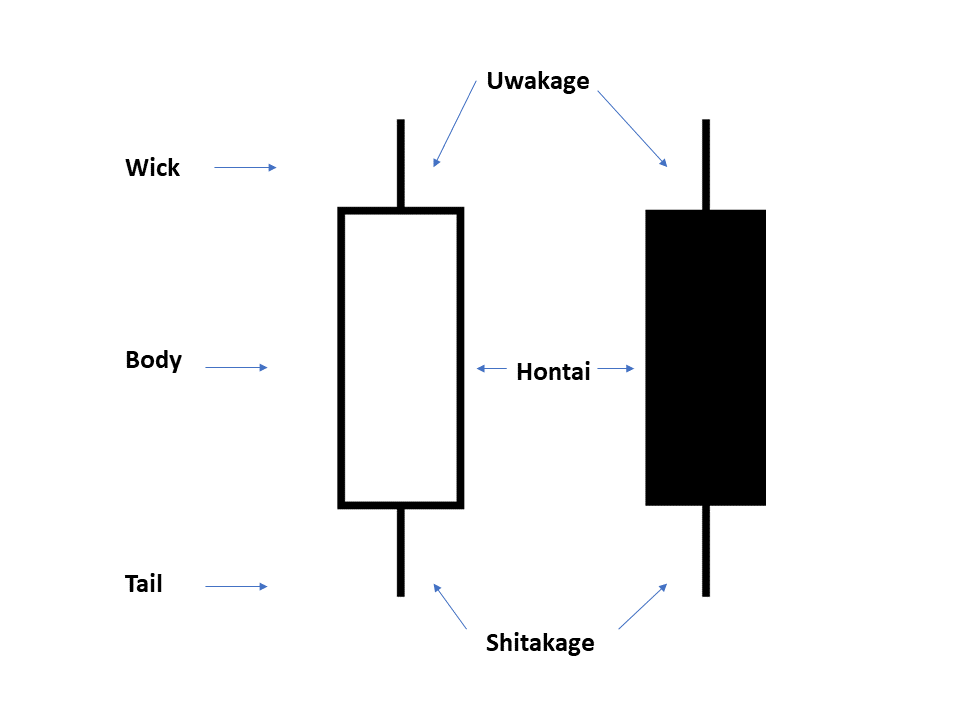
- Wick (upper shadow)
- Body
- Tail (lower shadow)
White candles are traditionally considered bullish while black candles (filled) is considered bearish.
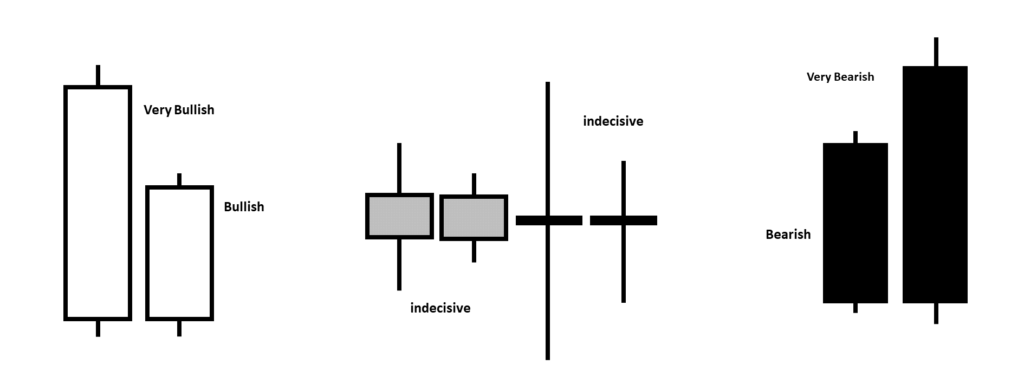
The position and size of the body and shadows in conjunction with the rest of the chart provides a clue on what the market sentiment is. The bigger the body the stronger the sentiment.
Basic Interpretation
The following is a guide for identifying candlestick patterns.
Bullish Reversal
- Belt Hold Pattern (Bull)
- Bullish (Doji) Star
- Bullish Engulfing
- Bullish Harami
- Bullish Kicking Pattern
- Dragonfly Doji (Bull)
- Hammer
- High Wave Doji (Bull)
- Inverted Hammer
- Morning Star (Doji)
- Piercing Line
- Three Inside Up
- Three Outside Up
- Three White Soldiers