

Technical Analysis is an art and not a science, one mans chart could be another man’s scratching. So that users can better understand what we mean in what we write lets set our rules for the road.
Any attempt at reading a chart must be rooted with the three precepts of Technical Analysis. To those who do not agree I would suggest finding other methods for organizing market information.
- The Market Discounts Everything. All information needed to establish the equilibrium price of an asset has been factored in by the market, your supply curve and demand curves are stable, move one or the other and the price of an asset changes. How do you move it? Introduce a new variable and find the next equilibrium point. This is the reason why market is in consolidation most of the time.
- Prices Move In Trends. The idea that prices move in trends gives us a foundational basis to expect that we will not see the high for the day one moment and the low in the next. If demand for an asset out strips supply you will see prices rise until a new equilibrium point is established, defining the high. If supply for an asset is greater than demand expect prices to fall until they are equal, establishing the low.
- History Repeats Itself. This core concept is why we look at our charts and plan our trades. Market behavior is observable through price charts and repetitive. By observing what happened in the past and the elements behind price movement we are able to develop trading plans establishing our targets, our cut off points putting order into how we trade.
We will typically start our Technical Analysis by establishing the factors behind price movement for any asset. This background information tells us what we should be aware of in terms of variables influencing market participants.
Key to how we look at the chart are support and resistances, these are price points that could potentially establish equilibrium areas for prices. Resistances are places where you find sellers joining the market to prevent any further increase in prices, while supports are price points that tend to see demand for an asset to pick up with buyers gobbling in the supply establishing the lows or a floor.
Ideally we look at these resistances as places to sell into, and supports as places to buy from.
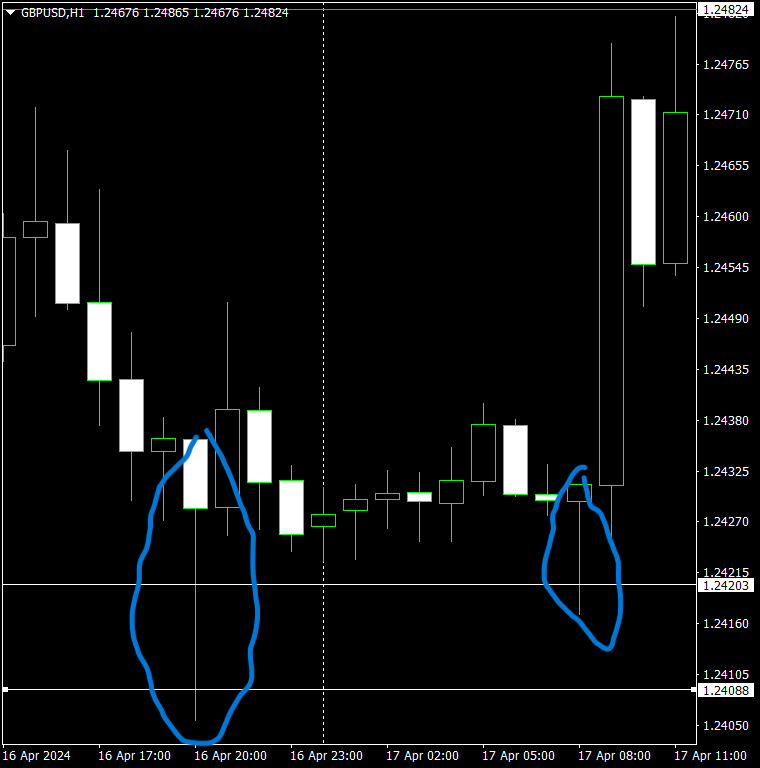
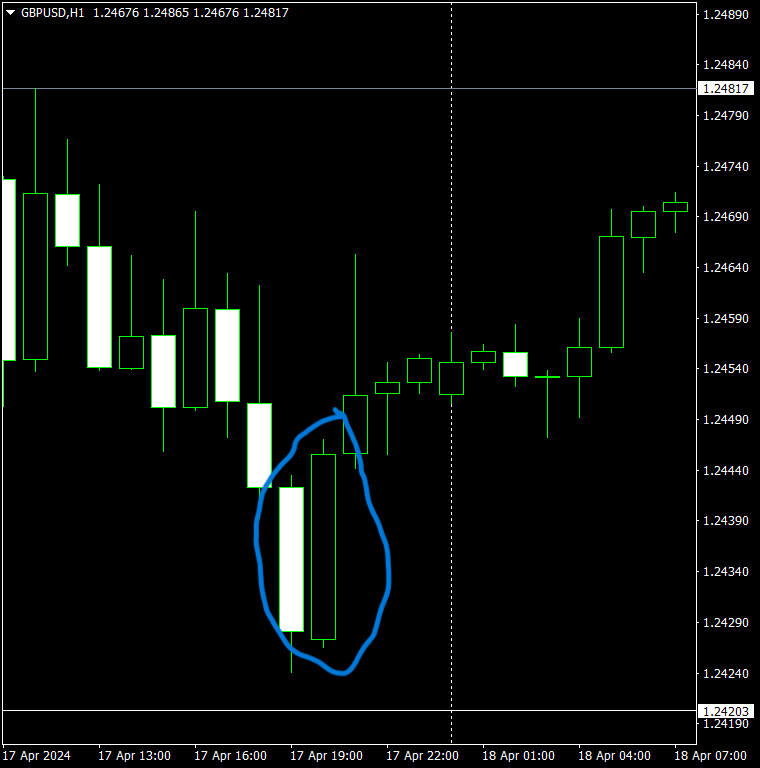
When To Buy
Market is dynamic and we do not pretend to know where and when people are poised to buy as such we typically prefer looking for these hourly chart scenarios before buying.
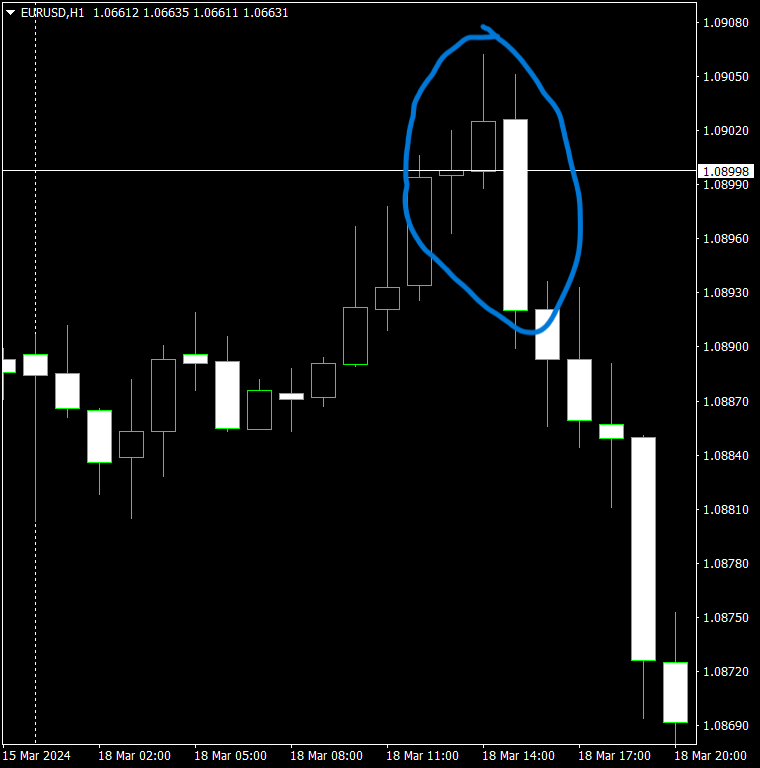
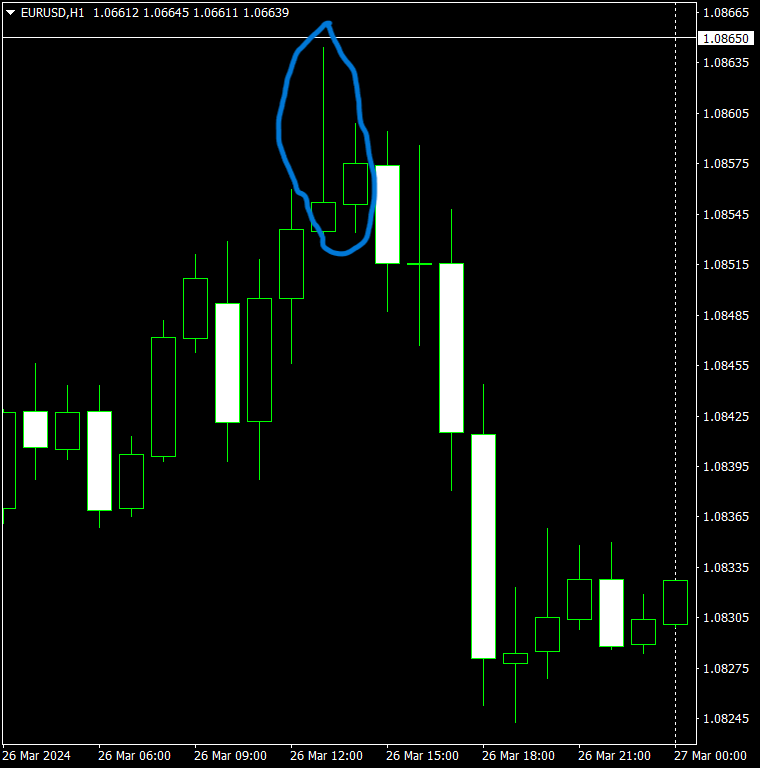
When To Sell
In like manner we would like to look for these hourly setups before selling.
For a more exhaustive guide on reversal patterns please view our Candlestick Charting Guide.